
In this Tutorial, we're going to dig into Weblogic's Application server to show the steps involved with monitoring the health state and application performance or Oracle Identity Manger.
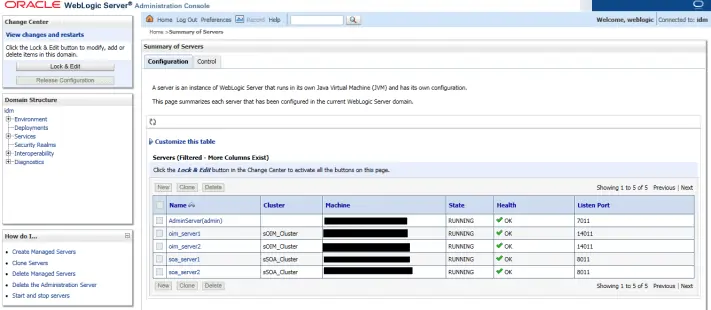
In this configuration, we have 1 Admin Weblogic server, 2 Oracle Identity Management (OIM) servers, and 2 Service-Oriented Architecture (SOA) servers.
1. Log Into The WebLogic Console.
The first step is log in to the WebLogic Administration Console with your Weblogic account.
You will get the following console after login.
2. Edit The Arguments Of The WebLogic Server.
Click on OIM server 1.Then click on Server “Start” as per the following image.
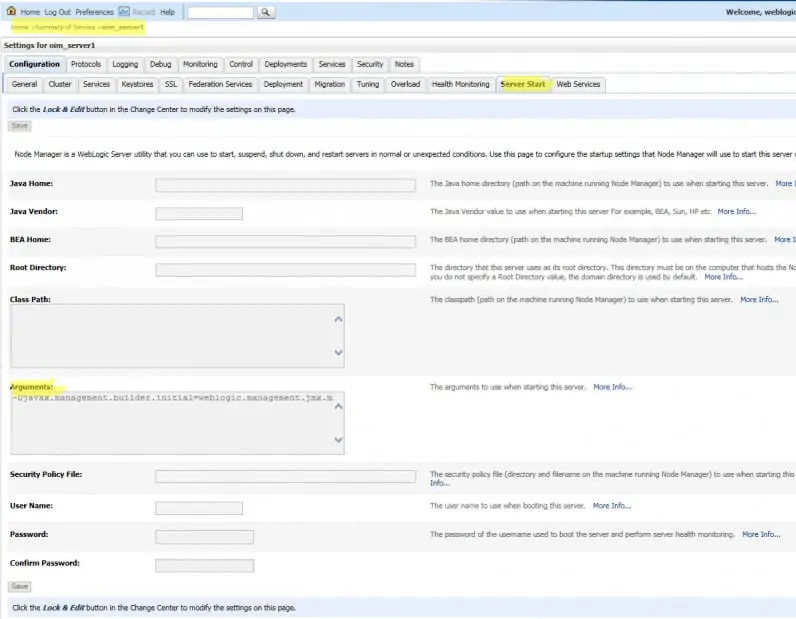
Click on “Lock and Edit”.
Next, go to arguments and add the following argument, This will enable JMX monitoring through a specific port.
Every server should have a unique port. For instance, I am using port 8888 for OIM server 1 and port 8889 for oim server2.
Argument :n on Jconsole.
Djavax.management.builder.initial=weblogic.management.jmx.mbeanserver.WLSMBeanServerBuilder Dcom.sun.management.jmxremote -Dcom.sun.management.jmxremote.port=8888 Dcom.sun.management.jmxremote.ssl=false -Dcom.sun.management.jmxremote.authenticate=false.
3. Restart The Server And Verify JMX Connection.
After saving the changes restart the oim server1 from the console. When the server is up, try to verify if the JMX connection is working or not.
Use JConsole to verify from your PC. Jconsole can be found at the following typical location.
“C:\Program Files\Java\jdk-9.0.1\bin\jconsole.exe”
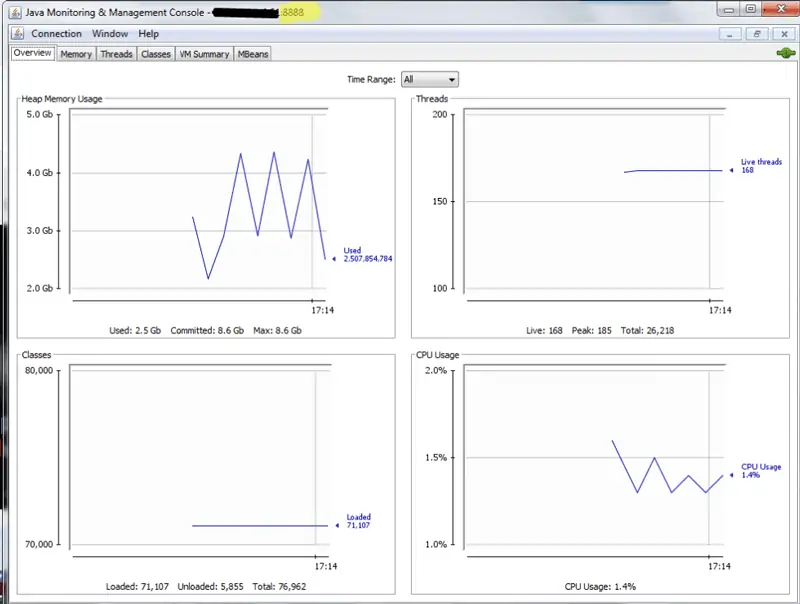
Start the Jconsole and select Remote Process put the servername:port and hit connect.
If the connection is successful then you will get the following screen on Jconsole.
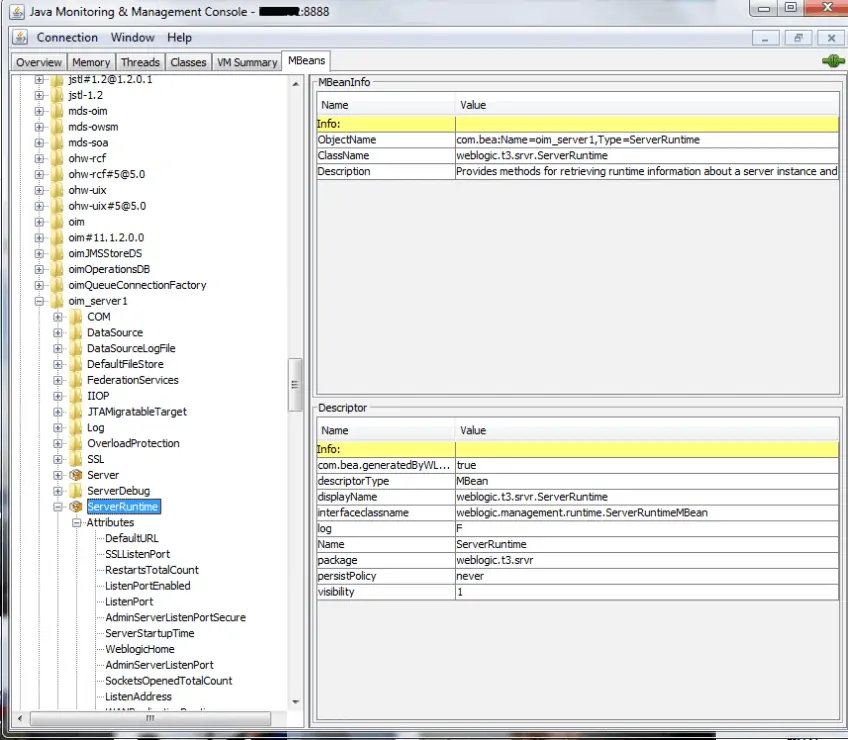
Next we need to review the Mbean Metrics. Click on MBeans and browse to oim server1 then go to “ServerRuntime”.
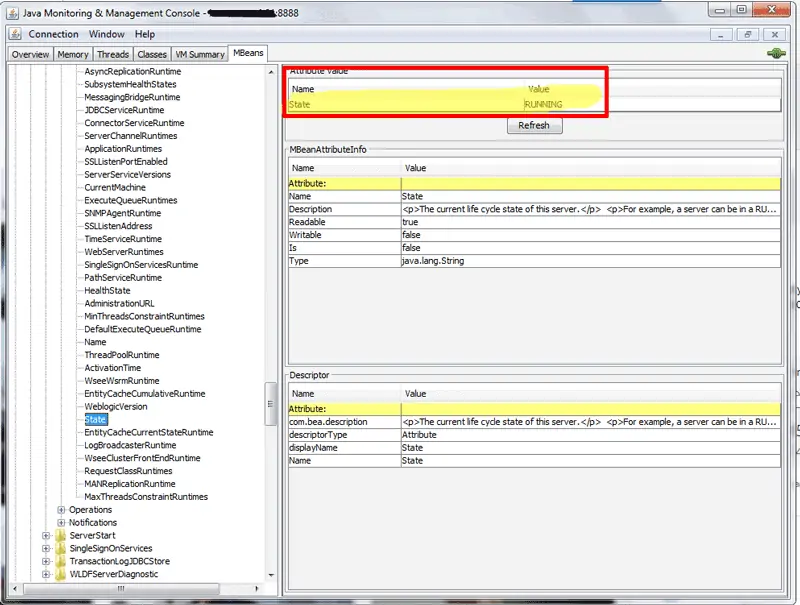
Under Attributes, you will find “State” click on the state to get its Value.
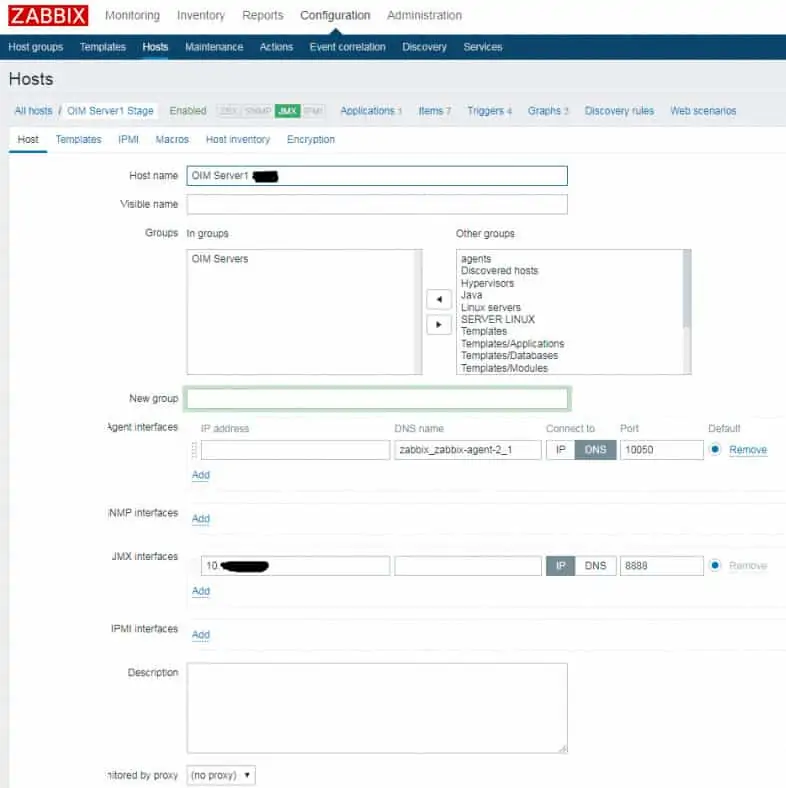
4. Finally Login To Zabbix To Complete The Application Monitoring Setup.
Now login to Zabbix and add the host as shown in the following image.
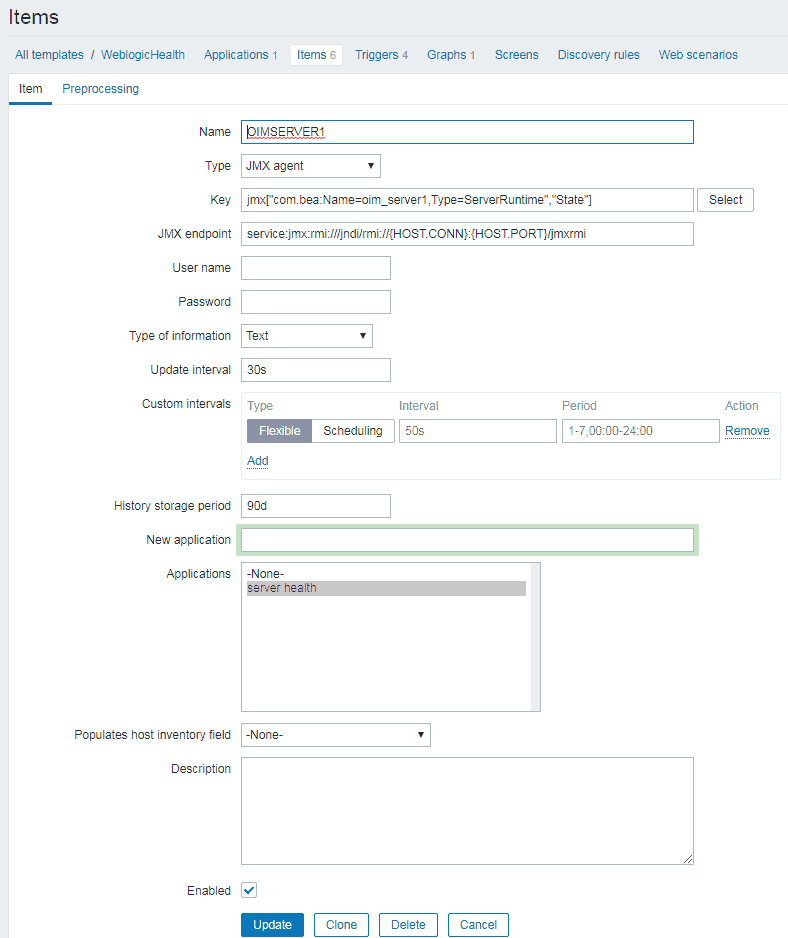
Create ITEM with the JMX Key.
Then create a trigger as per your requirement.
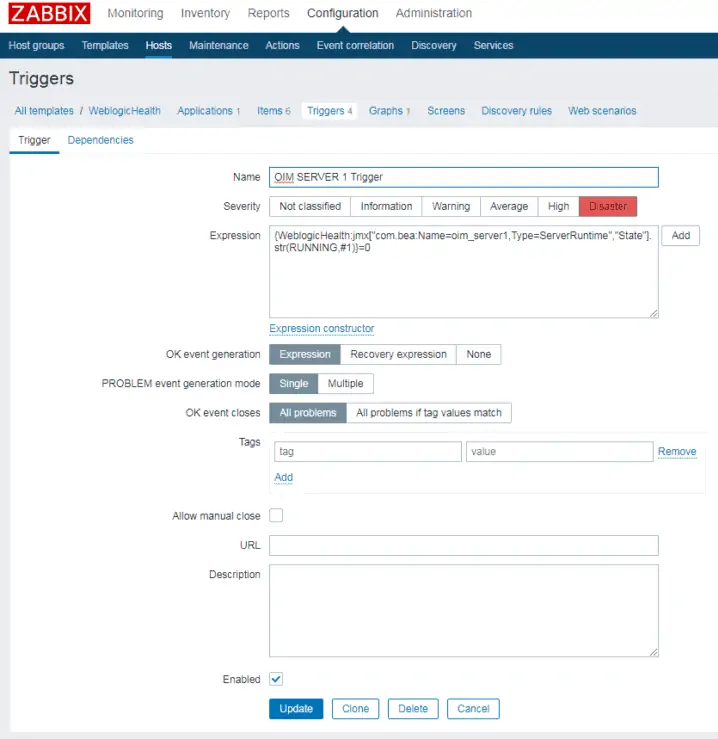
Now the Weblogic server's state is monitored by Zabbix and we will be able to review the performance metrics and any Application Issues.
For the complete monitoring dashboard setup, download the complete template from https://blog.zabbix.com/